
For additional assistance, please contact support@metavilabs.com.
The MetaVi Labs' Immune Killing Efficiency Assays
Fast Track AI Immune Killing Efficiency Assays are a set of customer specific (customized) AI and microscopy based assays. These assays monitor thousands of individual cell-to-cell interactions and generate over 35 unique metrics.
Contents
Benefits of FastTrack AI For Killing Efficiency Introducing Pathotaxis The Complex Battle - Killing vs Proliferation Sample Report Sample AI Analysis Movie Cytotoxicity Killing Efficiency Serial Killing Understanding the Serial Killing Histograms
Histogram of All Visible Serial Synapse - Percent of Effectors vs Attack Count
Histogram of Effective Visible Serial Synapse - Percent of Effectors vs Kill Count
Histogram Synapse Time to Cell Death
Average Number Targets Killed Per Visible Active Effector Cells
References
Benefits of FastTrack AI For Killing Efficiency
The MetaVi Lab's killing efficiency assay is designed to help you answer questions such as:
- How to measure the overall killing effectiveness of an IO treatment?
- How many engineered immune cells are required to eliminate a cancer cell population that itself is rapidly expanding?
- How many target cells can one immune cell kill?
- What percentage of the immune cells are actively engaging with target cells?
- How long does it take to kill one cancer cell?
- Do the immune cells get exhausted and then recover?
- Do the immune cells die after killing target cells?
- How do the immune cells discover the target cells?
Introducing Pathotaxis
Several approaches have been tried to harness the immune system in order to combat cancer cells. Besides tumor vaccination, which has been prosecuted as therapeutic strategy for decades, there are currently two promising strategies pursued as a second wave of immunotherapeutic approaches. Both of these current strategies have in common to activate specific cells that attack and kill cancer cells.
The first approach is to isolate and proliferate the patients’ own immune cells that may have potential to attack the cancer cells. These cells are usually isolated from the patients’ blood, treated by certain procedures and substances in a lab and then given back to the patient. Such cells are lymphokine-actived killer cells (LAK cells; Ref. 1), cytokine-induced killer cells (CIK cells; Ref. 2), special γδ T cells (Ref. 3) or other cytotoxic T cells (Ref. 4).
In a second, more sophisticated and more complex approach, some of the aforementioned cells are not only treated but genetically engineered in order to improve their specificity and killing efficacy to cancer cells. Most prominently, T cells with a chimeric antigen receptor (CAR) have been developed, which are currently being tested in more than 400 clinical trials. However, a major drawback in CAR T cell therapy is not only insufficient killing, but also the lack or ineffectiveness of finding the target: “Insufficient trafficking of CAR T cells to the tumor site represents another barrier for CAR T cell therapy.” (Ref. 5). It is of course imperative that the CAR T cells move towards the pathogenic target for killing.
Immune cells are able to sense gradients of substances and move towards them. A process that is known as chemotaxis. However, usually cytotoxic T cells and other cells of the immune system are attracted to sites of infection and inflammation by substances that are released at these sites by cells that are already present there, e.g. tissue macrophages. In analogy to that, we have termed the migration towards the pathogenic tumor cells as pathotaxis. Thus, testing of functionality of CAR T cells or other of the aforementioned cellular immunotherapeutic approaches comprises two steps: find the tumor cell and kill the tumor cell. Both have to be measured in parallel in a co culture assay of tumor cells as target and immune cells as effectors.
The Complex Battle - Killing vs Proliferation
The co-culture of effector cells and target cells is a battle between the killing rates of individual effectors and the proliferation rate of the targets. Both the killing efficiency of individual effectors and the ratio of the effectors to the targets play a key role in the overall cytotoxicity. Compounding the complexity, some effectors may be much more engaged than others and complex recruitment sequences may be in play. Some effectors may just sit out the battle altogether. Some effectors may find targets but not kill.
A condition can appear to be cytotoxic because low efficiency effector cells simply outnumber the target cells, or because a smaller number of very efficient effector cells is enough to kill the targets before they can proliferate. Note that if cytotoxicity is not rising, there may still be killing but the killing rate is lower than the proliferation rate. So we can still measure the efficiency of a small population of effector cells even if the overall result does not appear to be cytotoxic.
By observing the individual cell to cell interactions, this assay can extract information about individual cell efficiency independent of the overall cytotoxicity.
The metrics described below are designed to help you determine which percentage of the effectors are engaged and how efficient they are.
Sample Report
This report is of an example assay in which CAR T cells are co-cultured against Nalm6 B cell leukemia. There were 15 wells with 5 conditions (three wells for each condition). Click here to checkout the Sample Report
Sample analysis movie from FastTrack AI
This analysis movie is of co-cultured CAR T cells against Nalm6 B cell leukemia. The source image uses only phase-contrast with no fluorescence labels or dyes. Target cells (B cells) are marked by AI with green ID number, the effector cells (CAR T cells) are marked with a blue mark (the ID number is not shown for clarity), apototic target cells are marked in red.
Cytotoxicity
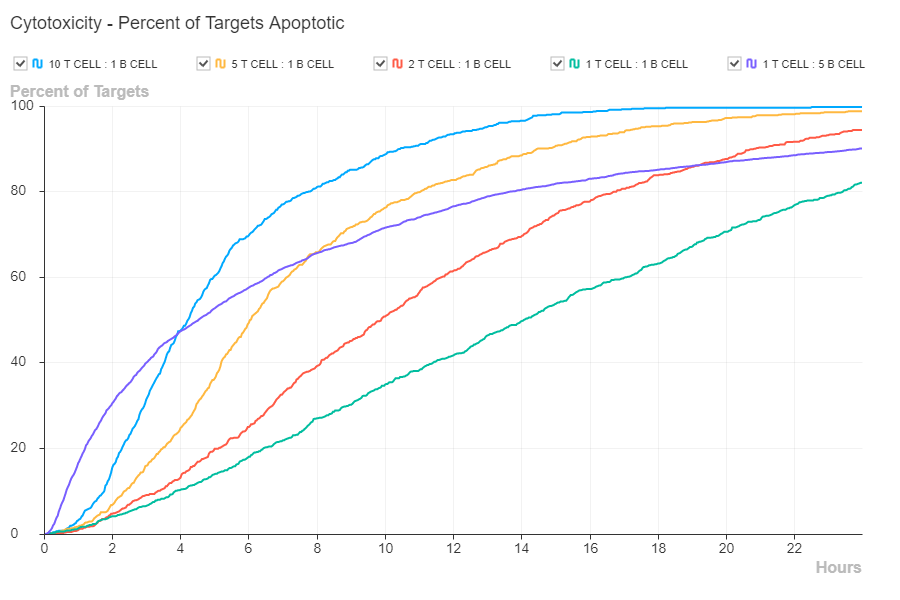
The Cytotoxicty metric is a read-out of the overall death rate for the observed condition. This does not measure the specific cytotoxicity of individual effector cells. Additional metrics are provided to determine which subpopulation of effectors are engaged and to what degree. So the cytotoxicity metric presented here provides the big picture view.
For example, if a large concentration of in-efficient effector (E) cells is co-cultured with a small number of target (T) cells, we would expect the cytotoxicity curve could be very steep, as in the example of the 10:1 (E:T) curve in the chart below, simply be because the effectors dramatically out-number the targets. So the cytotoxicity curve by itself does not tell us if the effector cells are efficient.
The advantage of the FastTrack AI Cytotoxicity metric has to do with how it is achieved. The AI system identifies individual living cells by morphology. When cells become apoptotic, this morphology changes dramatically. This observed change in morphology provides cell death event data with a time precision down to less than 15 minutes, and a cell count precision down to the single cell.
How we calculate Cytotoxicity
This is a measure of the overall target population decline. If the proliferation rate exceeds the rate of cell death, this value will be zero.
	PathogenLivingCellsNormalizedPerInterval[time-interval] = PathogenCellsLivingPerInterval[time-interval] / PeakPathogenCellsInPosition


	Cytotoxicity[time-interval] = 1 - PathogenLivingCellsNormalizedPerInterval[time-interval],
	except zero before time-interval of PeakPathogenCellsInPosition
Killing Efficiency
The MetaVi Labs' Killing Efficiency metric is a read-out effectiveness of an observed population of effector cells and target cells. It has two major components, time and E:T ratio.
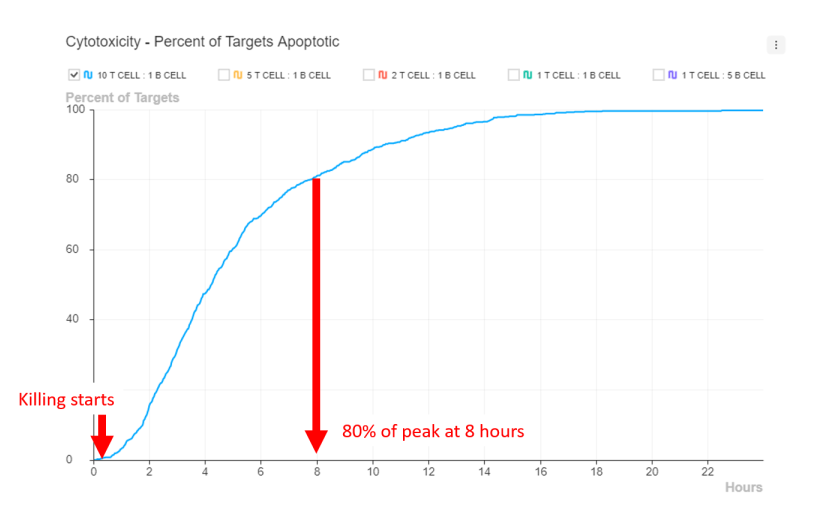
Efficiency increases as the killing time decreases. The less time required for killing the target population, the more effective the killers are. The killing time is measured from the the cytotoxicity slope. The start time is the point where the slope begins to increase. The end time is at the point where the curve reaches 80% of it maximum value. If the cytotoxicity does not increase, then the start and end time covers the entire duration of the experiment. The steeper the slope, the shorter the killing time. The flatter the slope, the longer the killing time.
Efficiency increases as Effector to Target (E:T) ratio decreases. That is, if fewer effectors can do the job, then these are more efficient. The number of effectors is measured at the start of the experiment. The target cell count used in the calculation is the accumulated number of target cells identified as apoptotic during the time period.
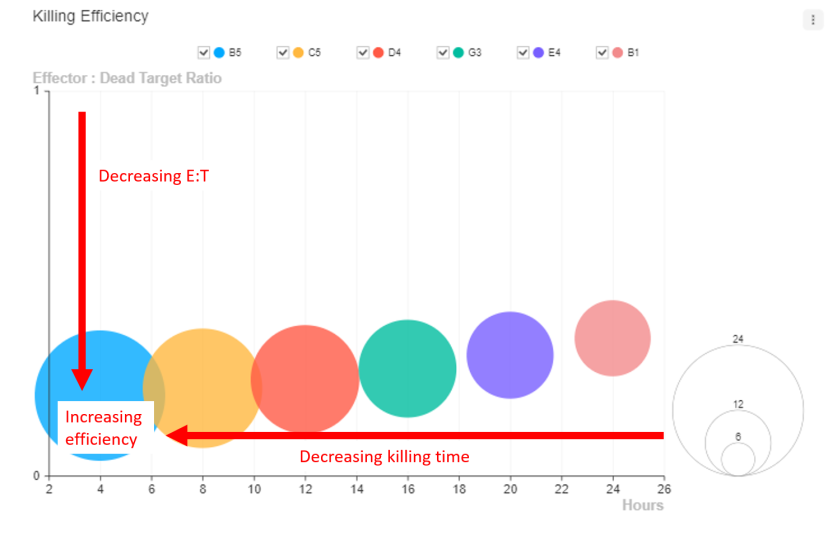
The Killing Efficiency (KE) bubble chart displays higher KE values with increasing size bubbles. So the larger bubbles (meaning more efficient effector cells), are near the lower left corner. The KE equation is setup such that small changes in the E:T ratio will have a bigger effect on KE than time. So the bubbles will get smaller as the Y-axis increases and also as the X-axis increases. But the changes will be more dramatic on the Y-axis than the X-axis.
In the example below, the killing duration is taken from near the start of the experiment to the 8 hour point. At 8 hours, the cytotoxicity curve has reached 80% of its peak value. The number of dead targets will be the number of observed dead targets from the start time to the 8 hour point.
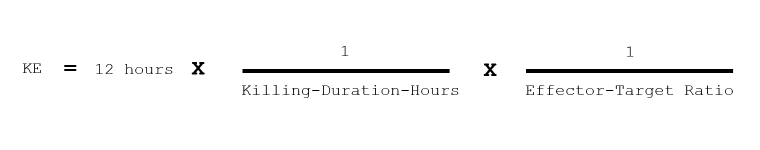
Effector-Count-At-Start is the number of effector cells observed in the first time point of the experiment.
Accumulated-Dead-Targets is the total number of targets cells observed to have transitioned from living to dead during the killing duration period.
Killing-Duration-Hours is the time point from start of rising cytotoxicity to 80% peak cytotoxicity. If the cytotoxicity is not rising, then it is the entire experiment duration. Note that if cytotoxicity is not rising, there may still be killing but the killing rate is lower than the proliferation rate. So we can still measure the efficiency of a small population of effector cells even if the overall result does not appear to be cytotoxic.

Serial Killing
The MetaVi Labs' Killing Serial killing metrics are a read-outs of the number of target cells on effector cell can kill. AI tracks individual immune cells as they travel from one target to another. The ability of AI to track immune cells as they travel from target to target and form synapses with the targets is highly dependant on target cell type and culture design. We will discuss these culture design tecniques in detail below.
By tracking individual cells FastTrack AI can measure immune-cell-to-target-cell contact duration and number. It can measure the attractiveness of the target cell. It can also count the number of immune cells which do not engage with target cells.
Co-culture Design for Serial Killing Tracking
The key challanges are:
- Identifing effector vs target Cells
- Maintaining individual effector tracks when effectors make synapse with Targets
- Maintaining individual target tracks when targets aggregate
- Maintaining individual effecto-target contacts tracks when targets aggregate
Techniques to overcome the challanges:
- Use only phase-contrast when target cells are solid tumors. Has the advantage that there is no fluorescence enduced toxicity or imparement of function. Has the disadvantage of reduced ability to track individuals when cells make contact. Use of ibidi slides dramatically helps in this case. The ibidi slides seperate targets so that effectors can be tracked moving from target to target.
- Use a fluorescence label on the effector cells. The advantage is dramatically increased tracking accuracy of immune cells especially when in synapse with targets.
- Use ibidi micro-pattern adhesion slides. This has the advantage of physically seperating target cells. This slide uses special surface chemitry which may not be effective with all cell types.
- Use ibidi micro-well slides. Very useful for isolating both effectors and targets. Dramatically increased measurement precision. The disadvantage is reduced cell counts per position, requireing additional microscope scan time to cover a greater surface area.
- Liquid cancers: use a fluorescence label on one cell type. If both effector and target are immune cells, the morphology alone is not sufficient for Ai to seperate the cells without at least one cell type being labeled.
Understanding the Serial Killing Histograms
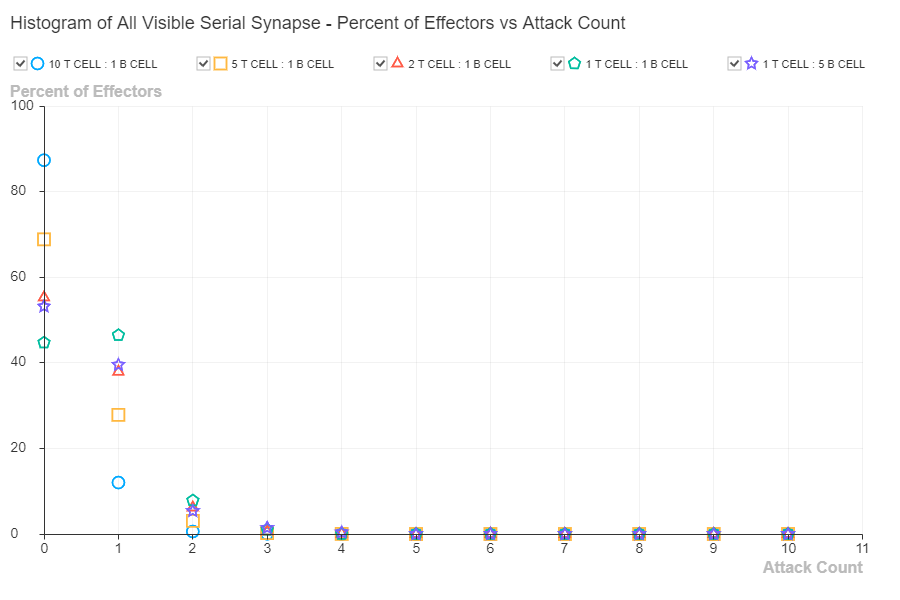
Histogram of All Visible Serial Synapse - Percent of Effectors vs Attack Count
All ... Synapse indicates all visible synapses whether resulting in target apoptosis or not.
Synapse indicates an effector was in contact with a target for at least 30 minutes.
Visible is a reminder that not all synapses are visible and hence detectable by AI.
Serial indicates we are reporting consecutive syanpses.
The Y-axis reports the percentage of all visible effectors. The X-axis reports the synapse count for that percentage. For example, about 87.3% of the visible effectors in the 10:1 condition did not form any synapses. About 12.0% did form one synapse, and less than 0.6% did form two synapses.
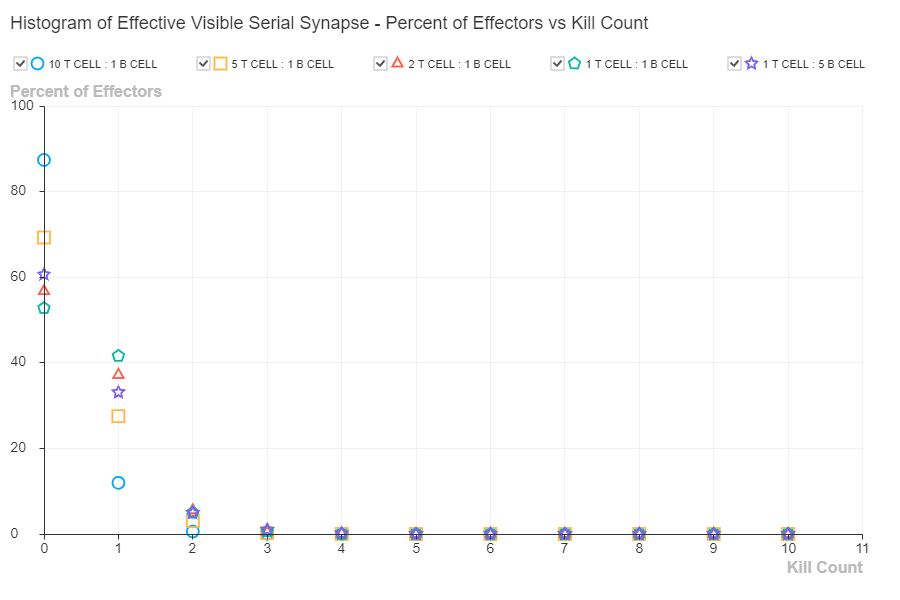
Histogram of Effective Visible Serial Synapse - Percent of Effectors vs Kill Count
Synapse indicates an effector was in contact with a target for at least 30 minutes.
Effective indicates the synapses resulted in target cell death.
Visible is a reminder that not all synapses are visible and hence detectable by AI.
Serial indicates we are reporting consecutive syanpses.
The Y-axis reports the percentage of all visible effectors. The X-axis reports the kill count for that percentage. For example, about 87% of the visible effectors in the 10:1 condition did not form any synapses resulting in target apoptosis. About 12.5% did form one effective synapse, and less than 0.5% did form two effective synapses.
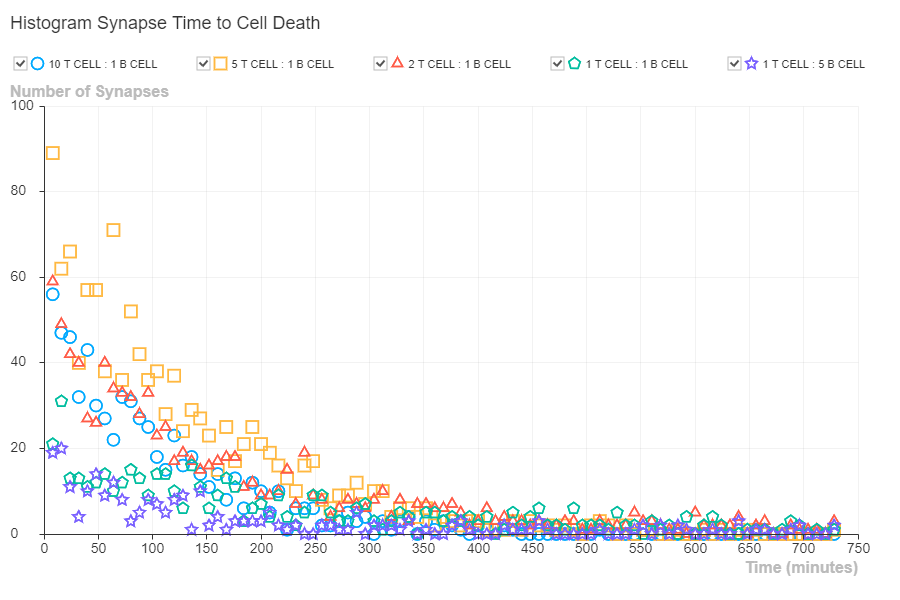
Histogram Synapse Time to Cell Death
Synapse indicates an effector was in contact with a target for at least 30 minutes.
Time to Cell Death indicates the duration of contact (less the initial 30 minutes) until apoptosis is detected. The detection of apoptosis is based on the loss of a visible healthy cell.
The Y-axis reports the percentage of all visible synapses. The X-axis reports the time duration for that percentage. For example, about 56% of the visible synapses in the 10:1 condition resulted in apoptosis 8 minutes after the initial 30 minute contact, or 38 minutes from first contact.
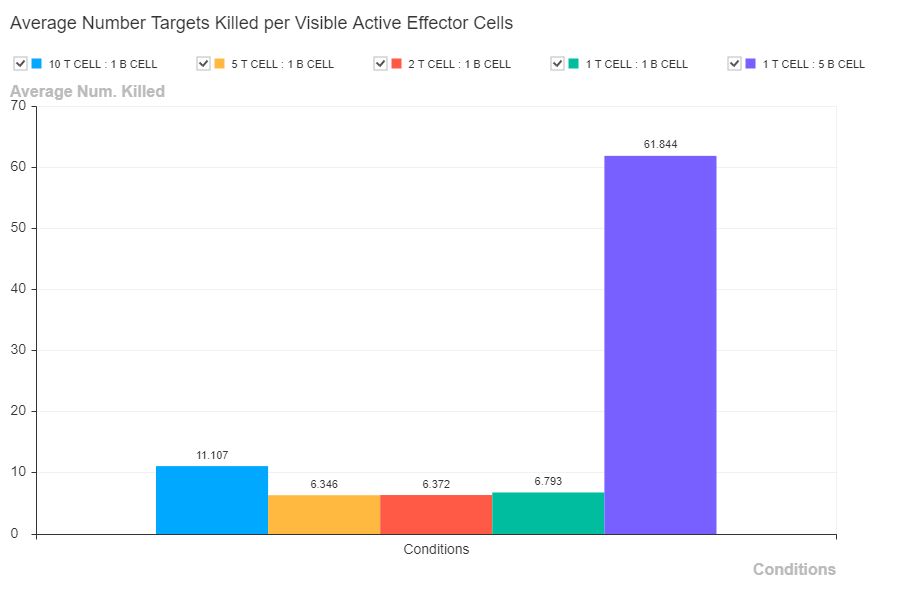
Average Number Targets Killed Per Visible Active Effector Cells
Average Number Targets Killed Per Visible Active Effector Cells is calculated by totallying all observed apoptosis events and dividing by the total active effector cells.
Visible is a reminder that not all cells are visible and hence detectable by AI.
Active an effector that formed at least one synapse. Synapse is defined at contact with a target for at least 30 minutes.
References
1. Grimm, E.A., et al. (1982) Lymphokine-activated killer cell phenomenon. Lysis of natural killer-resistant fresh solid tumor cells by interleukin 2-activated autologous human peripheral blood lymphocytes. J Exp Med 155(6): 1823-1841.
2. Schmidt-Wolf, I.G.H., et al. (1991) Use of a SCID mouse/human lymphoma model to evaluate cytokine-induced killer cells with potent antitumor cell activity. J Exp Med 174(1): 139-149.
3. Kondo, M., et al. (2008) Zoledronate facilitates large-scale ex vivo expansion of functional γδ T cells from cancer patients for use in adoptive immunotherapy. Cytotherapy 10: 842–856.
4. Dijkstra, K.K., et al. (2018) Generation of tumor-reactive T cells by co-culture of peripheral blood lymphocytes and tumor organoids. Cell 174: 1586-1598.
5. Mirzaei, H.R, et al. (2017) Chimeric antigen receptors T cell therapy in solid tumor: challenges and clinical applications. Frontiers in Immunology 8: 1850.